


To use the 96 well plate, utilize well F12 on the probe height adjustment tool (CN-0298-01). For the 384 well mag plate, which is used in the Human High Sensitivity 384 well kit, use well B7.
40-014
FLEXMAP 3D® System
The FLEXMAP 3D system makes it possible to multiplex up to 500 analytes through the combination of differentially dyed fluorescent microsphere sets & an innovative instrument design.
Synonym(s):
3D System, FLEXMAP 3D
Sign Into View Organizational & Contract Pricing
All Photos(1)
About This Item
UNSPSC Code:
41116133
eCl@ss:
32161000
NACRES:
NB.51
Recommended Products
Quality Level
manufacturer/tradename
Milliplex®
technique(s)
multiplexing: suitable
detection method
fluorometric
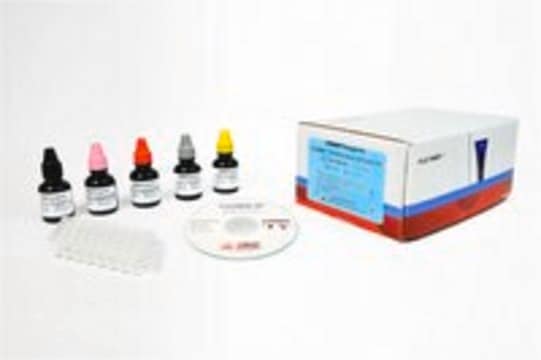
General description
The FLEXMAP 3D® system makes it possible to multiplex up to 500 analytes through the combination of differentially dyed fluorescent microsphere sets and an innovative instrument design. Features such as automated probe height adjustment, simplified routine maintenance operations and an intuitive software interface make FLEXMAP 3D® a flexible and user-friendly multiplexing platform capable of performing a variety of protein and nucleic acid applications. The new xPONENT 4.0 software controls the FLEXMAP 3D system and offers interfacing options for laboratory information systems (LIS) as well as automation.
Application
The FLEXMAP 3D system makes it possible to multiplex up to 500 analytes through the combination of differentially dyed fluorescent microsphere sets & an innovative instrument design.
Legal Information
FLEXMAP 3D is a registered trademark of Luminex Corp
MILLIPLEX is a registered trademark of Merck KGaA, Darmstadt, Germany
Disclaimer
Unless otherwise stated in our catalog or other company documentation accompanying the product(s), our products are intended for research use only and are not to be used for any other purpose, which includes but is not limited to, unauthorized commercial
Certificates of Analysis (COA)
Search for Certificates of Analysis (COA) by entering the products Lot/Batch Number. Lot and Batch Numbers can be found on a product’s label following the words ‘Lot’ or ‘Batch’.
Already Own This Product?
Find documentation for the products that you have recently purchased in the Document Library.
-
Could you provide details on which wells to use on the FM3D probe height adjustment tool for the 384 and 96-well plates utilized in the Milliplex kits?
1 answer-
Helpful?
-
-
I am planning to create a new xPonent protocol template for my assay using a Cytokine Milliplex kit. Which analysis settings do you recommend: Fit of all standards or Mean of replicates?
1 answer-
We generally use the Mean of Replicates method, although Luminex prefers the Fit of All Standards approach.
Ultimately, the choice between the two methods is left to the researcher to determine the best option for their SOP. Importantly, this choice does not significantly impact sample results.
Here's a brief overview of the two methods:
Fit of all standards: This method determines the standard curve by using each individual standard replicate when calculating the standard curve. For instance, if duplicates of a 7-point standard curve are run, the software will calculate the standard curve using 14 points. This method applies only to quantitative analysis.
Mean of replicates: This method involves averaging the individual standard replicates when calculating the standard curve. Similarly, this method applies only to quantitative analysis. For instance, if duplicates of a 7-point standard curve are run, the software will calculate the standard curve using 7 averaged points.Helpful?
-
Active Filters
Our team of scientists has experience in all areas of research including Life Science, Material Science, Chemical Synthesis, Chromatography, Analytical and many others.
Contact Technical Service