Steroid Hormone Analysis with Supel™ Swift HLB DPX
Madison Kilpatrick, Application Chemist1, M. James Ross, R&D Senior Scientist2
1DPX Technologies, 2Merck
Introduction
Routine hormone analysis is necessary for establishing and monitoring patient diseases. For example, the continuous monitoring of cortisol levels can help diagnose a patient with Cushing disease (high cortisol) or Addison disease (low cortisol).2,3 A robust method for determination of steroid hormones in serum is imperative in diagnostics and treatment. The Supel™ Swift HLB DPX Tips (3 mg bed, Hamilton®) allow for reduced sample volume, sample evaporation mitigation, and offer a fully automated sample preparation approach. In this method, a total of 9 steroids (cortisone, cortisol, 11-deoxycortisol, androstenedione, testosterone, dehydroepiandrosterone, 5α-dihydrotestosterone, 17α-hydroxyprogesterone, and progesterone) were analyzed as a panel to provide a variety of testing applications and disease diagnostics.
The Supel™ Swift HLB sorbent provides good selectivity and sensitivity for steroids in a neutral solution1, allowing for dilution with water prior to injection. The sorbent has significant versatility in analyte binding due to the co-polymer phase containing both hydrophilic and lipophilic functional groups.1
This validated method used 100 µL of serum and the final volume available for injection was approximately 100 µL, allowing for a 1:1 concentration factor without solvent evaporation. Recoveries for the 9 analytes range from 65-86% (Table 7). The LOQs for all analytes fall below clinically relevant values, and linear dynamic ranges were between 0.025 ng/mL and 250 ng/mL. The automated extraction method allows up to 96 samples to be processed simultaneously in approximately 20 minutes prior to LC-MS/MS analysis.
Experimental Conditions
Methods
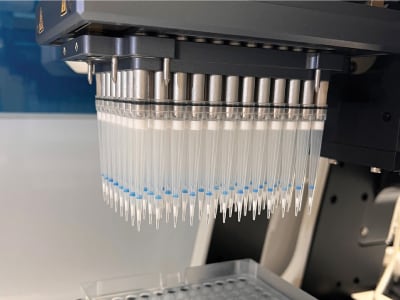
A Hamilton® Microlab NIMBUS96 was utilized to automate sample preparation using the Supel™ Swift DPX HLB Tips (Figure 1). The analysis was performed on an Agilent 1290 LC system coupled with a SCIEX Triple QuadTM 6500+ tandem mass spectrometer. LC column used was an Ascentis® Express C18 (2.7 µm particle size, L × I.D. 10 cm × 3 mm) joined with an Ascentis® Express C18, 2.7 Micron Guard Cartridge in an Ascentis® Express Guard Cartridge Holder. This combination allowed for an optimal separation of all steroids. An injection volume of 15 µL was found to be optimal to meet required cutoffs. The LC conditions are shown in Table 1. Ammonium fluoride additives are common in steroid analysis4 but were found to decrease retention time stability and were therefore omitted. The mass spectrometer source parameters are available in Table 2 with the transitions monitored in Table 3.

Figure 1.Supel™ Swift DPX HLB 3 mg (bed) Tips. The tips are being actively picked up by the automated liquid handler.
Serum Sample Preparation
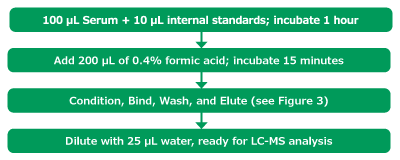
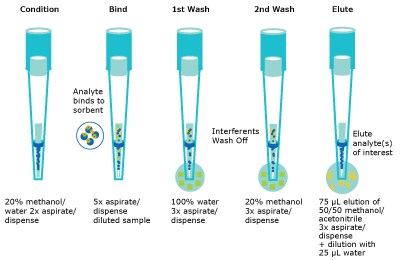
Serum was aliquoted (100 µL) into a 2 mL V-bottom polypropylene well plate. The internal standard mixture (200 ng/mL for all internal standards except for DHT and progesterone which were 500 ng/mL) was added (10 µL) and allowed to incubate for 1 hour at ambient temperature. The well plate was then loaded onto the NIMBUS96 system for the rest of the automated protocol. The automated liquid handler (ALH) picked up a set of standard transfer tips, added 200 µL of aqueous 0.4% formic acid to the sample and mixed thoroughly. This solution was then incubated for 15 minutes prior to sample extraction. While the protein dissociation step occurred, the ALH picked up a second set of transfer tips for aliquoting the wash solvents into appropriate well plates (Figure 4). After that the ALH picked up the Supel™ Swift HLB DPX Tips and conditioned the HLB sorbent by aspirating and dispensing 300 µL of 20% methanol from a buffer reservoir two times. Once the protein dissociation timer was complete, the ALH moved to the sample well plate and aspirated and dispensed the sample five times to bind analytes to the HLB sorbent. The ALH moved to the first wash location (300 µL of 100% water) and aspirated/dispensed three times, and sequentially moved to the second wash location (300 µL of 20% methanol) and aspirated/dispensed three times. The ALH ejected the Supel™ Swift HLB DPX Tips back into the original deck position and picked up the transfer tips to aliquot the elution solvent into the appropriate well plate. This was done to avoid solvent evaporation of the low elution volume while the previous steps of the method were completed. Finally, the ALH picked up the Supel™ Swift HLB DPX Tips again and moved to the elution location (75 µL 50/50 MeOH/ACN), aspirated/ dispensed three times. The tips were ejected, and standard tips were picked up to dilute the eluent with 25 µL of water. The final sample plate was then sealed and vortexed briefly for 5-10 seconds before submitting for analysis by LC-MS/MS injection. (Figures 2, 3, & 4)

Figure 2.Sample preparation method.

Figure 3.Schematic of the automated bind/wash/elute steps.

Ionization Effects and Recoveries
Ionization effects and recovery studies were performed as outlined by Scientific Working Group for Forensic Toxicology, SWGTOX.5
Briefly, recoveries were evaluated by preparing two sets of serum samples; the first that were spiked with internal standards prior to extraction, and the second set were serum samples that were spiked with internal standards after extraction.
Ion suppression/enhancement was evaluated by preparing two sets of samples. The first set being internal standards prepared in final solution composition (3 equivalents of 50/50 methanol/ acetonitrile to 1 equivalent of water) and the second set being the internal standards spiked into the post- extracted solution. All internal standard concentration were as described earlier (200 ng/mL, except for DHT and progesterone which were 500 ng/mL).
Results & Discussion
Method Development
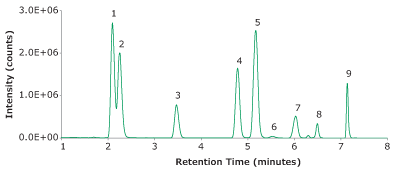
When analyzing endogenous compounds in complex biological matrices, optimal compound separation is imperative. While the panel here consisted of 9 compounds, there are dozens of known endogenous compounds to monitor to ensure analysis was selective and accurate. In the initial method development, a 50 mm column was evaluated, however, isobars were nearly impossible to separate. For example, DHEA and testosterone are isobars (both with a molecular weight of 288.42 g/mol). To achieve baseline separation, a 100 mm column was necessary. A second set of isobars includes three isomers; 11-deoxycortisol, 17-deoxycortisol and 21-deoxycortisol. These three co-eluted and required isocratic separation. Without incorporation of an isocratic plateau (0.5 - 3.7 min) and using a longer column (100 mm), separation of the isobars proved to be unachievable. 17-Deoxycortisol and 21-dexoycortisol were not evaluated further in the analysis. Refer to Figure 5 for chromatographic separation achieved by this method (LC-MS method in Table 1-3).

Peak IDs:
1. Cortisone (50 ng/mL)
2. Corstisol (50 ng/mL).
3. 11-Deoxycortisol (5 ng/mL)
4. Testosterone (5 ng/mL)
5. Androstenedione (5 ng/mL)
6. DHEA (5 ng/mL)
7. 17α-Hydroxyprogesterone (5 ng/mL)
8. DHT (5 ng/mL)
9. Progesterone (5 ng/mL)
Figure 5. Representative TIC of a spiked blank serum with 9 steroids.
Method Repeatability
A three-day precision and accuracy study was performed for 8 analytes utilizing external quality control serum from UTAK and NIST-971a (UTAK Laboratories, Inc., Valencia, CA, USA and NIST, Gaithersburg, MD, USA). Neither source offered verified values for DHT, therefore it was omitted. Ultimately, the inter-day precision of the 8 analytes (excluding DHT) varied from 0.30% to 12%. Intra-day precision ranged from 1.9% to 8.5%. Samples were performed in triplicates over three days.
Using the data summarized in Table 4, Figures 6, and 7 were created to compare theoretical UTAK versus measured values. A correlation graph comparing the UTAK provided values to the InTip™ dispersive SPE is shown in Figure 6. Overall, a slightly higher average steroid concentration was found using Supel™ Swift HLB DPX compared to the UTAK provided values with a slope of 1.19 with excellent linearity represented by R2 = 0.9974, when considering all controls sampled. Another representation of this data is presented in Figure 7 using the Bland-Altman analysis. The near zero bias (-3.02) and the evenly scattered error (positively and negatively) demonstrates that the two methods are interchangeable.

Figure 6.Correlation Graph of the Total Steroid Concentration comparing the two different approaches for the eight hormones (progesterone, OH-progesterone, testosterone, androstenedione, cortisone, cortisol, 11-deoxycortisol, DHEA). Method 1 corresponds to the UTAK provided values and Method 2 corresponds to using Supel™ Swift HLB DPX Tips. Low Controls: y = 1.07x - 0.44, R2 = 0.9953, High Controls: y = 1.20x - 1.70, R2 = 0.9985.

Figure 7.Total Steroid Concentration across eight different hormones simultaneously determined. Method 1 corresponds to the UTAK provided values and Method 2 corresponds to using Supel™ Swift HLB DPX Tips. The dash lines represent a 95% confidence interval.
Like with the UTAK data, using the data summarized in Table 5, Figures 8, and 9 were created. A correlation graph comparing the NIST values to the InTip™ dispersive solid phase extraction (dSPE) is shown in Figure 8. Overall, a slightly higher average steroid concentration was shown using Supel™ Swift HLB DPX Tips compared to the NIST provided values with a slope of 1.11 with excellent linearity represented by R2 = 0.9922 with a near zero y-intercept. Another representation of this data is presented in Figure 9 using the Bland-Altman analysis. The near zero bias (-0.09) and the evenly scattered error (positively and negatively) demonstrates once again that the two methods are interchangeable.

Figure 8.Correlation graph of the Total Steroids Concentration comparing the two different values for the four hormones (progesterone, OH-progesterone, testosterone, and androstenedione). Method 1 corresponds to the NIST values and Method 2 corresponds to using Supel™ Swift HLB DPX Tips. Female Controls: y = 0.88x + 0.11, R2 = 0.9934, Male Controls: y = 1.13x - 0.04, R2 = 1.00.

Figure 9.Total Steroid Concentration across four different hormones simultaneously determined. Method 1 corresponds to the NIST values and Method 2 corresponds to using Supel™ Swift HLB DPX Tips. The dash lines represent a 95% confidence interval.
Great sensitivity and chromatographic separations allowed for levels of detection in the sub-nanogram per milliliter range. Limits of quantification (LOQ) range below the lowest calibrator level at 0.025 ng/mL for all analytes except cortisone and cortisol, which had a lowest calibrator of 0.25 ng/mL. The LOQ was calculated based on a signal-to-noise above 10 and the limit of detection (LOD) was based on a signal-to-noise above 3. In all cases, the reproducibility at the lowest calibrator is well within the Bioanalytical Validation Guidelines (BAVG)6 of 15% which corresponds with the non-lowest accepted calibrator (Table 6). According to the BAVG, the accepted reproducibility criteria for the lowest calibrator is 20%.
Using the SWGTOX guidelines and a total of eight replicates for each analyte, the recoveries and the matrix effects for each analyte were determined (Table 7). Using Eq 1, the recovery of the method was determined in the range of 65-86% with an average of 71% recovery. The influence of matrix was determined using Eq 2 with an average of 33% ionization suppression.

Eq. 1

Eq. 2
Conclusion
The use of Supel™ Swift HLB DPX Tips for the analysis of various blood serum steroids was shown to be reproducible across two different standards (UTAK and NIST) and offers an alternative that is faster and programmable for clinical testing laboratories. This method provides the necessary sensitivity relevant to clinical values while also enabling the ability for high throughput sample processing for fast turnaround times. The accurate and sensitive serum analysis method described here can be a valuable tool for quantification of steroids in serum.
See the complete offer of DPX tips at SigmaAldrich.com/dpx
For more solutions for clinical and forensic testing visit us at SigmaAldrich.com/clinical
References
如要继续阅读,请登录或创建帐户。
暂无帐户?