Correlation of FcR Affinity Chromatography with Glycan Pattern and ADCC Activity of a Therapeutic Antibody
Cara Tomasek, Leader, Product Management1, Cory E. Muraco, Product Manager Liquid Chromatography Technologies2
1Tosoh Biosciences, North America, 2MilliporeSigma
Introduction
Antibody-dependent cell-mediated cytotoxicity (ADCC) is an important mechanism of action (MOA) of monoclonal antibodies used in cancer treatment. Selecting suitable cell lines and optimizing culture conditions towards the expression of antibody candidates with desired ADCC activity is an essential part of the R&D process. A fast and straightforward approach to easily access ADCC activity would facilitate screening of many clones or monitoring the effect of upstream process variations. Other stages of R&D and production could benefit from fast ADCC assessment as well: comparing biosimilar and originator, detecting lot-to-lot variations, monitoring product stability, to name but a few.
Fc Receptor and ADCC Activity
ADCC starts with the binding of the Fab region of an antibody to a target cell, e.g., a cancer cell. Binding of the Fc domain of that antibody to Fcγ receptors on the outer membrane of natural killer (NK) cells triggers degranulation into a lytic synapse and finally the apoptosis of the cancer cell (Figure 1). The glycan microheterogeneity of the Fc domain, on the galactose and core-fucose levels, influences the binding of the Fc domain to Fcγ receptors.1


Figure 1. Antibody-dependent cell-mediated cytotoxicity
Original image by Satchmo2000, distributed under a CC-BY 3.0 license.
Current ADCC activity tests are either cell-based bioassays or surface plasmon resonance (SPR) measurements using immobilized Fcγ receptors. A new approach combines the specificity of the FcγIIIa receptor (FcγRIIIa) with the easy handling of an HPLC method.
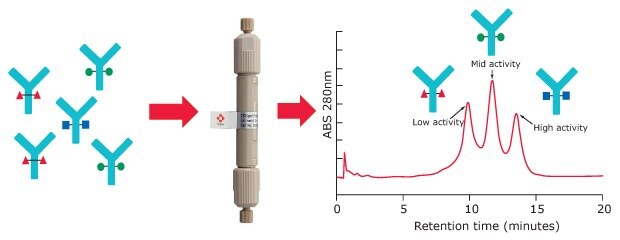
For Fc receptor affinity chromatography, a recombinant FcγIIIa receptor ligand is immobilized on a stationary phase. Glycoforms of an antibody sample can be partly separated based on the strength of their binding to the FcR ligand. Resulting peaks can be assigned to low, medium, and high ADCC activity (Figure 2).

Figure 2.FcγRIIIa affinity chromatography
Taking the well-known therapeutic antibody rituximab as an example, this application note demonstrates that the pattern of FcγRIIIa affinity chromatography shows a good correlation with the results obtained by an ADCC reporter assay. Fractions collected from HPLC peaks with different receptor affinity also show different glycosylation patterns at the Fc domain.
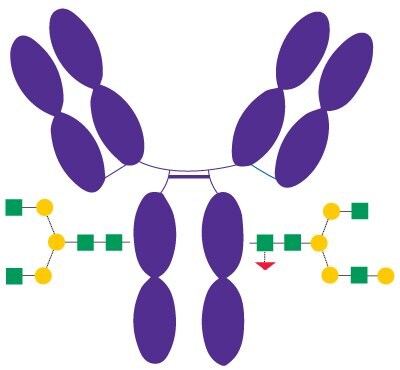
Rituximab (Figure 3) is a recombinant chimeric human/ mouse monoclonal IgG1 antibody approved in 1997 and used to treat certain autoimmune diseases and types of cancer. Besides other effects of rituximab, its Fc portion mediates antibody-dependent cellular cytotoxicity (ADCC) and complement-dependent cytotoxicity (CDC).2 N-glycans bound to the Fc domain of rituximab contain mainly G0F and G1F structures.

Figure 3.Schematic Diagram of Rituximab
FcR Affinity Chromatography of Rituximab
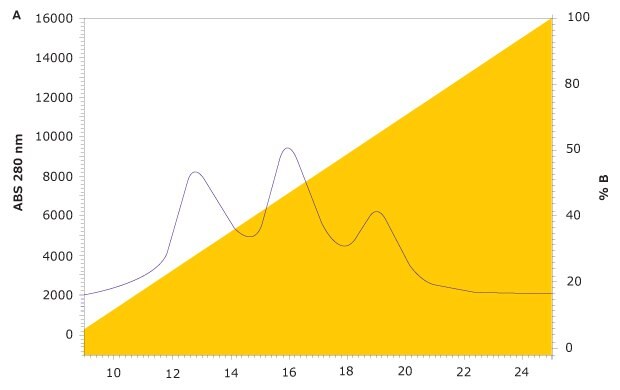
In FcγRIIIa affinity chromatography, purified antibody or cell culture supernatant is injected under conditions that promote binding of monoclonal antibodies (mAbs) to the FcγRIIIa ligand. Elution of bound mAb variants is performed by lowering the pH of the mobile phase in order to disrupt the target/ligand interactions. The higher the affinity of a mAb variant to the receptor, the higher the retention time of the respective peak.
FcR affinity chromatography analysis of rituximab on the new TSKgel® FcR-IIIA-NPR column results in three peaks representing variants with low, medium, and high FcγRIIIa affinity (Figure 4). Subsequent characterization of the three peaks was carried out using a semi-preparative prototype FcR-IIIA column to collect fractions. For each peak, ADCC activity was analyzed with a standard ADCC reporter bioassay kit (Promega). Glycan analysis was also carried out on each fraction using HILIC-UHPLC.

Figure 4.FcγR Affinity Analysis of Rituximab on TSKgel® FcR-IIIA-NPR
ADCC Bioassay of Rituximab and FcR Affinity Fractions
The Fc effector reporter bioassay uses the FcγR and Nuclear Factor of Activated T-cells (NFAT)-mediated activation of luciferase activity in effector cells to determine ADCC efficacy and potency of antibodies. Figure 5 shows the ADCC reporter bioassay response to rituximab and to the three fractions collected from FcR affinity chromatography (low, medium, high FcγR affinity). Rituximab is shown as the grey points; fraction 1, representing low FcγR affinity, is shown in blue; fraction 2, representing medium FcγR affinity, is shown in red; and fraction 3, representing high FcγR affinity, is shown in green.3
Table 1 shows the half maximal effective concentration (EC50) values obtained by the reporter bioassay test. The lower the EC50 value, the higher the ADCC potency. As expected, peak 3 (high FcRγ affinity, green) shows the highest ADCC potency and efficacy in the bioassay. Peak 2 shows the intermediate and peak 1 shows the lowest ADCC efficacy and potency. ADCC efficacy and potency of the original rituximab lies between the low and medium affinity fractions.

Figure 5.ADCC Reporter Bioassay Response to Rituximab
Glycan Analysis of FcR Affinity Fractions
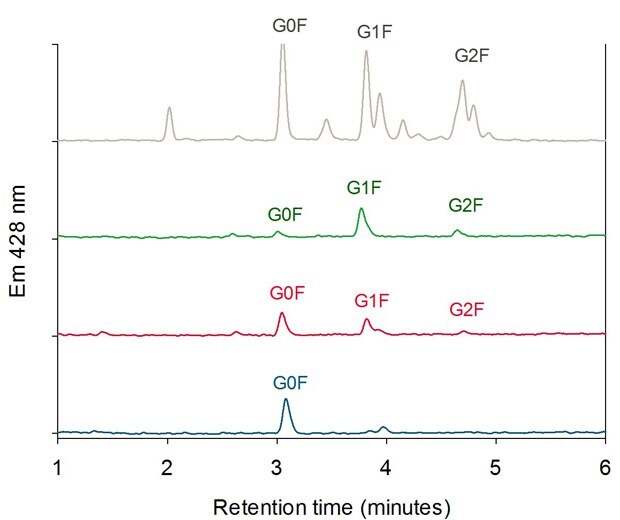
For each peak in Figure 4, cleaved and 2-aminobenzamide-labeled (2AB-labeled) N-glycans were characterized by HILIC-UHPLC. Figure 6 shows the glycan pattern of the FcR affinity fractions compared to a glycan library. The antibody glycoforms collected in peak 3 (highest affinity) show mainly galactose containing N-glycans (G1F and G2F). Peak 2 glycoforms contain more G0F glycans than peak 3 and glycoforms collected in peak 1 (lowest affinity) show predominantly fucosylated glycans without galactose units (G0F).

Figure 6.HILIC Analysis of Oligosaccharides of the three FcR Affinity Fractions (Peak 1 blue, Peak 2 red, Peak 3 green) compared with a 2-AB Labeled Biantennary Glycan Library (grey).4
Conclusions
The ADCC activity bioassay results show that high retention on the TSKgel® FcR-IIIA-NPR column corresponds to a high ADCC activity. The HILIC-UHPLC glycosylation pattern analysis of the FcR affinity fractions also matches the common understanding that terminal galactose units of Fc-glycans typically enhance affinity to FcγRIIIa and ADCC activity while core fucose units decrease ADCC activity of antibodies. These results confirm that FcγRIIIa affinity chromatography allows fast assessment of biologic activity and glycoform pattern of antibodies.
TSKgel and Tosoh Bioscience are registered trademarks of Tosoh Corporation.
Rituximab was kindly provided by Rentschler Biopharma.
To see our selection of TSKgel® columns, visit us at SigmaAldrich.com/tskgel
References
Para seguir leyendo, inicie sesión o cree una cuenta.
¿No tiene una cuenta?