Optimizing Serum Sample Preparation for Free Testosterone Determination: A Comparative Analysis Using BioSPME
Introduction
The industry’s gold standard for sample preparation of free hormones from serum has been associated with equilibrium dialysis.1 It is the free portion of hormones, including testosterone, that is responsible for biological activity.2 Free testosterone accounts for approximately 1-2% of total testosterone.3 In males, this generally falls in the range of 20–230 pg/mL, and for females in the range of 0.6–10 pg/mL (0.8-1.4% of total).4 Solid phase microextraction (SPME) is a relatively new method to employ for the measurement of free concentration and one that has recently been incorporated into a 96-pin device for use with conventional well plates. Biocompatible SPME, or BioSPME, has been shown to be a fast sample preparation technique.5
Methods
The BioSPME sample preparation method for the 200 µL samples utilized a Supel™ BioSPME C18 (Figure 1) 96-pin device with a Hamilton® STARlet system.
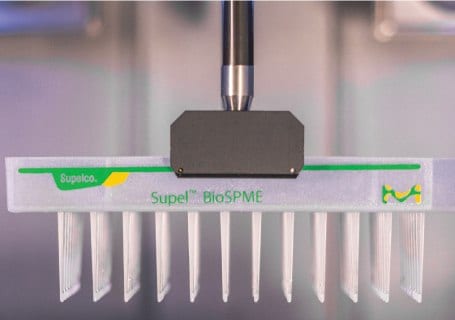
Figure 1.Grippers from Hamilton® Starlet moving the Supel™ BioSPME device.
Although the method includes multiple steps, it was developed to have only a total processing time of 1 hour (Figure 2). A volume of 500 μL acetonitrile was used for the conditioning and the same volume of water for the wash solution. The desorption and derivatization steps were performed off-line. The acetonitrile desorption solution, 50 µL, contained 25 pg/mL D3-testosterone prior to derivatization. Derivatization was performed with an addition of 200 mM hydroxylamine hydrochloride, 100 µL, at 60 °C for 20 min with agitation at 600 rpm.6

Figure 2.Overview of sample preparation prior to analysis by LC-MS/MS. A detailed outline of the automation is shown below.
Overview of the steps of the Hamilton® Starlet Robot liquid handler system in an automated version |
|---|
The free testosterone concentration in serum samples was determined using simultaneously extracted calibrators (10 – 200 pg/mL) prepared in phosphate-buffered saline and analyzed by the method described in Table 1. Quantifier and qualifier transitions were utilized for the natural and isotopically labeled testosterone and derivatized testosterone (Table 2).
Injection volumes of 60 µL of the final, prepared samples of the total 150 µL were used to accommodate reinjections if required.
*Te-NHOH represents the derivatized testosterone withHydroxylamine
Free testosterone in male serum samples was previously determined by externally validated equilibrium dialysis-based methods at respective laboratories (Lab A, Lab L, and Lab Q). Samples were purchased from Lab A and were previously tested. The serum samples sent to Labs L and Q were collected in collaboration with the Clinical & Translational Science Institute at Pennsylvania State University. Aliquots of these samples were submitted for testing (extraction 1), with the remainder of the samples kept at -80 °C. A second extraction was performed after one month in the -80 ºC freezer (extraction 2). A total of 30 unique serum samples were tested using BioSPME in a randomized analysis. In general, samples were tested in duplicate or triplicate depending on the availability of sample quantities. Images of the actual samples are shown in Figures 3a & 3b.
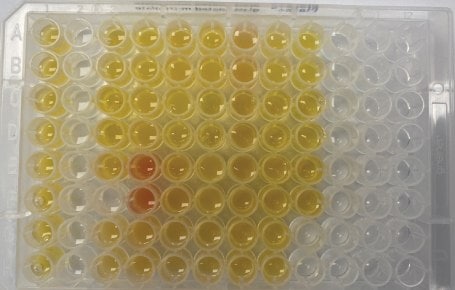
Figure 3a.Actual sample for extraction 1. Each loaded well contained 200 µL of either serum sample (yellow/red) or a calibrator prepared in phosphate buffered saline. Serum samples were not excluded if they appeared lipemic (cloudiness from lipids/fats), icteric (yellowing from bilirubin), or hemolytic (presence of ruptured red cells).
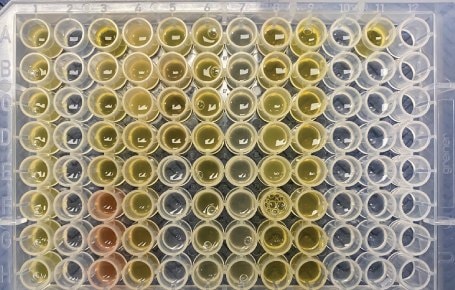
Figure 3b.Actual samples for extraction 2. Each loaded well contained 200 µL of either serum sample (yellow/red) or a calibrator prepared in phosphate buffered saline. Serum samples were not excluded if they appeared lipemic (cloudiness from lipids/fats), icteric (yellowing from bilirubin), or hemolytic (presence of ruptured red cells).
Results
The instrumental limit of detection, LOD, and lower limit of quantification, LLOQ, of the derivatized testosterone, Te-NHOH, were determined by serial dilution and n=12 injections (Table 3).
The LOD was 0.2 pg/mL and the LLOQ of the quantifier transition, Te-NHOH-1, was 1 pg/mL, with an RSD of 8.0%. The LLOQ of the qualifier transition, Te-NHOH-2, was 1 pg/mL, with an RSD of 9.5%. The peak integration ratio for the quantifier/ qualifier was 1.10, with an RSD of 15.1%. The sensitivity was achieved by replacing the 20 µL standard injection loop on the Agilent 1290 LC instrument with a 100 µL loop to allow for larger injection volumes. Representative chromatograms of the diluted samples down to 0.2 pg/mL are available in Figure 4.
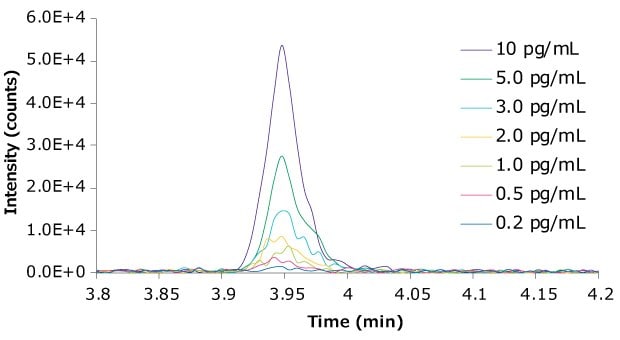
Figure 4.Chromatogram of Te-NHOH-1 at various concentrations ranging from 10 pg/mL down to 0.2 pg/mL in (1:2 acetonitrile:water).
The extracted calibration curve for free testosterone quantification, range of 10–200 pg/mL, had a R=0.9964 and 0.9936 using a 1/(x2) regression (Figure 5). Representative total ion chromatograms of three different samples are presented in Figure 6. A representative chromatogram of the monitored transitions is shown in Figure 7.
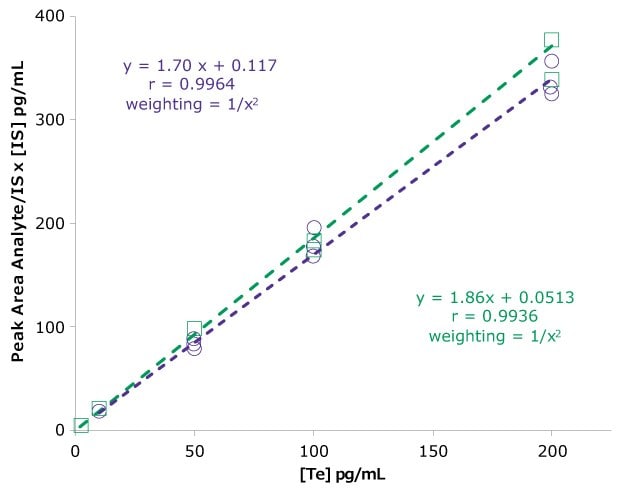
Figure 5.Extracted calibration curves from phosphate buffered saline for determination of free testosterone. Purple circles – extraction 1 and green squares – extraction 2.

Figure 6.Total ion chromatograms for three different samples: 25 pg/mL extracted calibrator (purple), Lab L serum sample (green), and Lab A serum (yellow), each after the derivatization step.
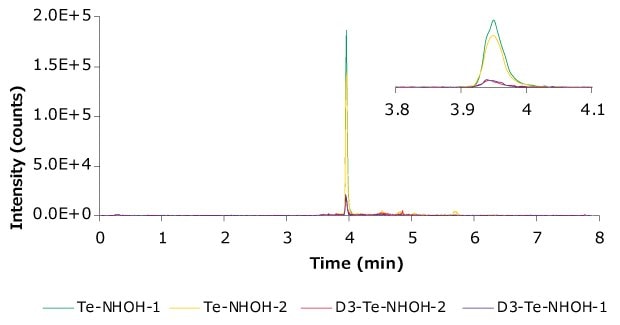
Figure 7.Representative chromatogram (Lab A #1) showing the transitions monitored. Zoomed-in window to highlight the peak.
Correlation plots between the free testosterone determined by validated equilibrium dialysis (Lab A, range 20.3–194.4 pg/mL) and the BioSPME method prior to LC-MS/MS yields a linear correlation of y = 0.917x – 6.23, R2 = 0.954 (extraction 1) and y = 0.956x – 1.57, R2 = 0.976 (extraction 2). Extraction 2 was performed over a month later after undergoing a freeze/thaw cycle and storage at -80 °C in the interim (Figure 8). Including the additional samples from Labs L and Q, linear correlations of y = 0.923x – 6.37, R2=0.921 (extraction 1), and y = 0.941x + 0.15, R2=0.960 (extraction 2) (Figure 9). In either correlation graph, the R2 is above 0.92 and indicates an almost ideal correlation between the two methods. When considering the existence of a y-intercept, it may result from a couple of different reasons. These include different sample preparation methods, instrumentations, and analysts. Another variable that is unaccounted for is the state of the serum samples, as some of the samples were pretested (and underwent freeze-thaw cycles) while others were shipped across the country.

Figure 8.Correlation of free testosterone for Lab A samples between two different sample preparation methods; BioSPME, determined internally by R&D, and equilibrium dialysis (ED), pre-determined externally. Purple circles for extraction 1, and green squares for extraction 2.


Figure 9.Correlation of free testosterone for all samples; Lab A (purple), Lab L (yellow), and Lab Q (green) between two different sample preparation methods; BioSPME, determined internally by R&D, and equilibrium dialysis (ED), determined externally using a CLIA validated equilibrium dialysis LC-MS/MS method. Circles for extraction 1 (top); squares for extraction 2 (bottom).
The derivatized internal standard peak area counts, D3-Te-NHOH, on a per-well basis, were monitored and used as a quality check. An average internal peak area count across all tested wells was 5.84 x 10⁴ ± 0.61 x 10⁴ (RSD 10.6%) and 6.40 x 10⁴ ± 0.58 x 10⁴ (RSD 9.1%) for extraction 1 and extraction 2 respectively. The percent difference from the average for extraction 1 and extraction 2 is shown in Figure 10. This uncertainty is contributed by the pipetting for desorption and derivatization plus from LC-MS/MS measurement. In all samples, the amount of underivatized testosterone was below the limit of detection indicating that derivatization process was complete.
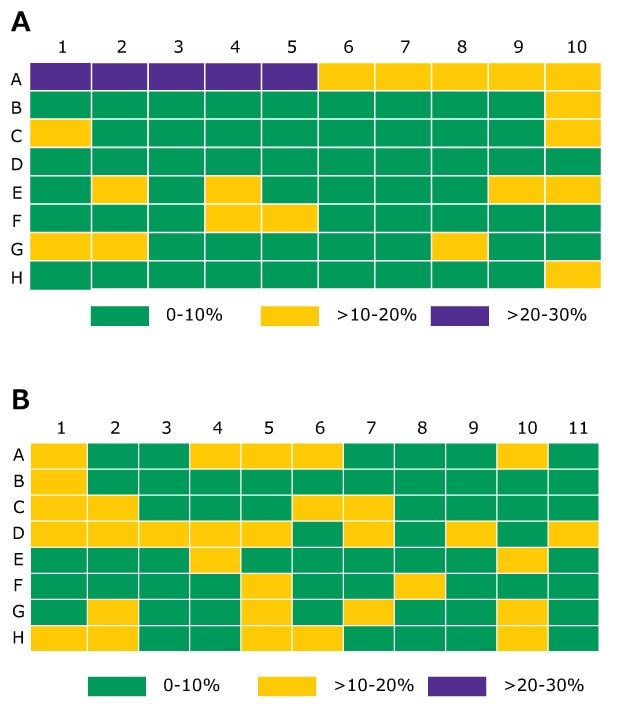
Figure 10.The percent difference from the average internal standard by the pipetting for desorption and derivatization plus from LC-MS/MS measurement. In all samples, the across the plate. Columns 2 and 10 were testosterone calibrators, remaining columns were samples. (A -extraction 1; B -extraction 2)
Conclusion
A BioSPME extraction method prior to analysis by LC-MS/MS was developed, and the evaluated results showed a strong correlation (R2 = 0.92–0.96) for serum samples analyzed by externally validated equilibrium dialysis LC-MS/MS for free testosterone. The BioSPME method was automated by using a Hamilton® Starlet Robotic system and can be adapted to other robotic liquid handlers that have gripper functionality. The time to process one 96-well plate was approximately an hour. The developed LC-MS/MS detection method used derivatization of the final extract by hydroxylamine hydrochloride to increase the sensitivity for the detection of free testosterone.
Learn more about BioSPME at SigmaAldrich.com/biospme
Note: Supel™ BioSPME devices are to be used for sample preparation of serum and plasma for the subsequent analysis and concentration determination of free analytes via LC-MS and LC-MS/MS. The Supel™ BioSPME devices are to be used with compatible automation instruments via gripper paddle maneuver, or manually via hand maneuver through the sample preparation workflow steps. Supel™ BioSPME devices are for R&D use only. Not for drug, household, or other uses.
References
To continue reading please sign in or create an account.
Don't Have An Account?