Determination of Urea in Milk by HPTLC
Sanjay Poman, Application Scientist
Abstract
This article details a quick HPTLC method to detect urea in milk using a TLC plate scanner and a Silica Gel 60 F254 HPTLC Plate. The results indicate that none of the four milk samples tested exceeded the acceptable limit of 70 mg/100 mL, demonstrating the method’s efficacy for quick and reliable detection of urea, thus offering a robust tool for quality control and food safety in dairy products.
Section Overview
Introduction
Urea also known as carbamide is an organic compound serves an important role in the metabolism of nitrogen containing compounds by animals and is the main nitrogen containing substance in the urine of mammals. Urea is widely used in fertilizers as a source of Nitrogen and is important raw material for the chemical industry. Milk is an important food component in our regular diet. Urea in cow‘s milk varies from 20 mg to 70 mg/100 mL of urea and urea content above this range is said to be adulterated or deliberately added.1 These unhygienic materials are mainly added to compensate the expenses and hence to yield higher profit by cheap and low quality adulterants in order to increase the solid non-fat value in milk.
The present study illustrates a new method based on thin layer chromatography (TLC) using HPTLC plates to establish a quick limit test for the detection of urea in milk.
Experimental
The four locally sourced milk samples were investigated. Each sample (5 mL) was diluted with 5 mL of water and then centrifuged at 2500 rpm for 10 minutes. The supernatants were then used for analysis. The standard with 0.7 mg/mL urea (representing the limit concentration of 70 mg/100 mL) was prepared in water/methanol (1:9) v/v. The analysis was performed under conditions described in Table 1.

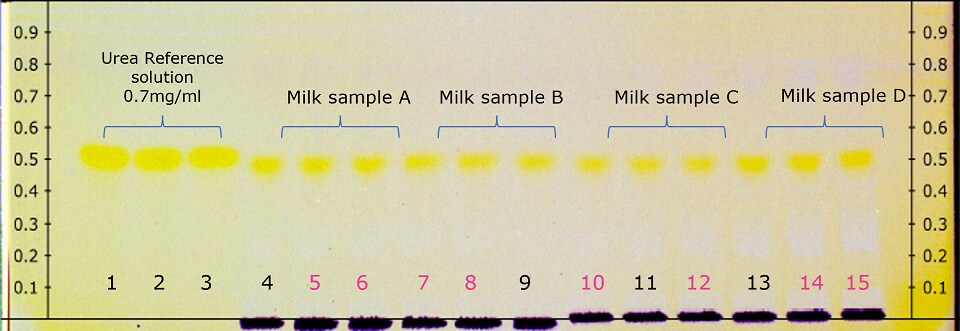
Figure 1.Derivatized HPTLC plate under in white light illumination (pink marked milk sample tracks quantified by densitometry see Table 2)
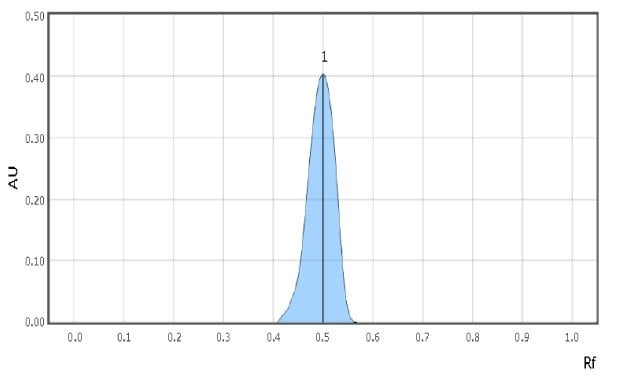
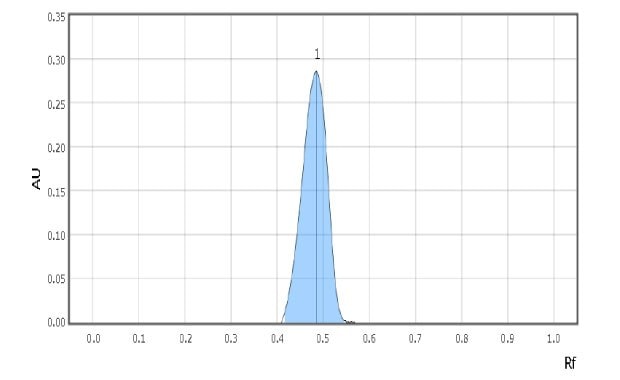
Examples of spot scans for the reference solution and a milk sample are shown in Figure 2 & 3. Retardation factor for reference solution and Test solution is 0.50 & 0.48 respectively indicating similar position and color.

Figure 2.Chromatographic Data Example - Reference Solution
Chromatographic Result Example - Reference Solution |
|---|

Figure 3.Chromatographic Data Example - Test Solution
Chromatographic Result Example - Test Solution |
|---|
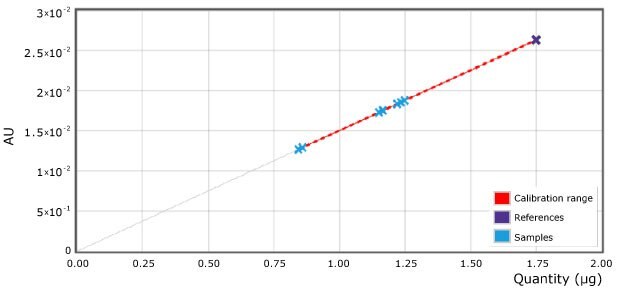
As examples 2 spots of each milk sample were quantified (Figure 4 & Table 2). The 4 different commercial milk samples tested as per the illustrated method showed urea concentration less than 1.75 µg on the plate or less than 0.7 mg/mL sample (700 ppm).

Figure 4.Applied calibration for urea and samples (scan at 440 nm). Reference point (reference solution) of 1.75 µg on plate is equivalent to 70 mg/100mL (700 ppm) in milk.
Conclusion
The here displayed method was used for a quick limit check of urea content in milk samples by HPTLC using a plate scanner for quantification. Four samples could be investigated on one plate, and none exceeded the limit value of 70 mg/100 mL. The HPTLC provides therefore a simple and quick option for the determination of urea content and possible food fraud in multiple milk samples in parallel.
Find more applications on Food & Beverage Testing.
References
Zaloguj się lub utwórz konto, aby kontynuować.
Nie masz konta użytkownika?