Determination of HMF in Honey using Chromolith® HighResolution RP-18e column following DIN 10751-3

Hydroxymethylfurfural
(5-(Hydroxymethyl)furfural)
Section Overview
Introduction
Hydroxymethylfurfural (HMF) is generated by thermal decomposition of carbohydrates or sugars. It can be detected in many heat-treated food and beverage samples such as fruit juice, milk, or honey. In the latter, low levels of HMF indicate its freshness and natural finish, while long-term storage or exposure to heat may lead to high HMF content in honey, caused by fructose decomposition.
HMF may also be carcinogenic, and so limits exist. The maximum allowed concentrations in the EU for non-tropical and tropical honey are 40 mg/kg and 80 mg/kg, respectively.1 In some regions, declarations for certain honey qualities have set HMF limits of <20 mg/kg.2
This application focuses on HMF test in honey according to DIN 10751-33 with HPLC-UV using a matrix-tolerant Chromolith® HighResolution RP-18 endcapped column 100 x 2 mm column. The sample preparation was performed with and without the use of Carrez-Reagents. Carrez clarification (with Carrez I & II solutions) is typically used to remove proteins or colloidal matrix components which might interfere with the analysis. However, with the Chromolith® monolithic silica HPLC column, this clarification step is not necessary. Due to its bi-modal pore structure, the column is more matrix tolerant and less prone to blockages. These features reduce labor requirements and so offer overall time savings for the method. In this study a comparison of methods with and without Carrez clarification is discussed.
Experimental
Standard preparation
- Diluent: Mobile phase
- Standard Solution (100 µg/mL): 10 mg of homogenized HMF was weighed into a 100 mL volumetric flask, dissolved in diluent, and filled up to the mark with diluent.
Sample preparation
Samples: Two honeys from a local beekeeper
Samples were prepared according to the following procedures:
- Sample Solution 1: Weigh 10 g of homogenized honey precisely to 0.1 g into a 100 mL beaker and dissolve in 50 mL diluent. Transfer quantitatively to a 100 mL volumetric flask. For protein precipitation and stabilization of HMF, 1 mL of Carrez I and 1 mL of Carrez II solutions were added. The volumetric flask was filled up to the mark with diluent and shaken for 1 min. Subsequently, proteins were removed by filtration using a paper filter. 1 mL of the filtrate was then filtered with a 0.45 μm syringe filter directly into a vial. (Figure 3)
- Sample Solution 2: Weigh 10 g of homogenized honey precisely to 0.1 g into a 100 mL beaker and dissolve in 50 mL diluent. Transfer quantitatively to a 100 mL volumetric flask. The volumetric flask was filled up to the mark with diluent and shaken for 1 min. 1 mL of the solution was filtered with a 0.45 μm syringe filter directly into a vial. (Figure 4)
- Sample spiked (40 mg/kg): 400 μL of the standard solution were added to 10 mL of each (Sample Solution 1/Sample Solution_2) before filtration.
Samples were analyzed by HPLC-UV on Chromolith® HighResolution RP-18ecolumn using conditions in Table 1.
Results & Discussion
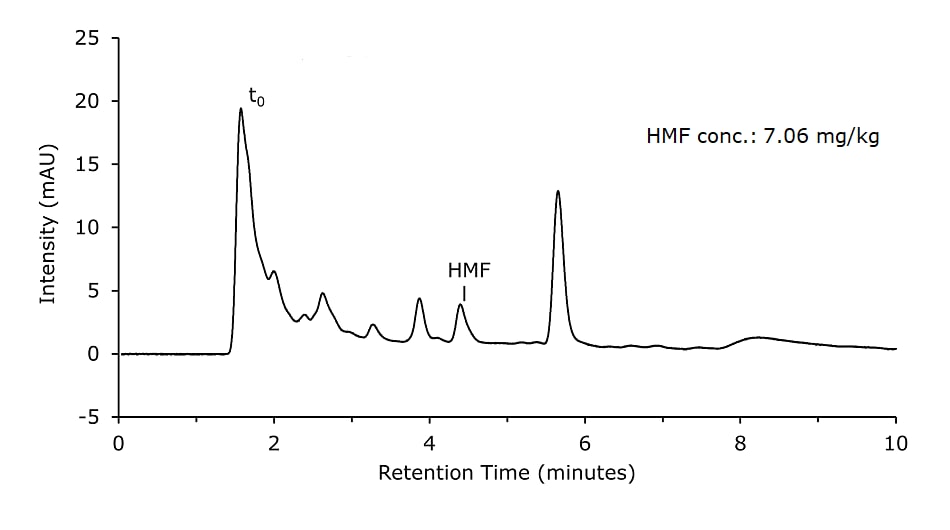
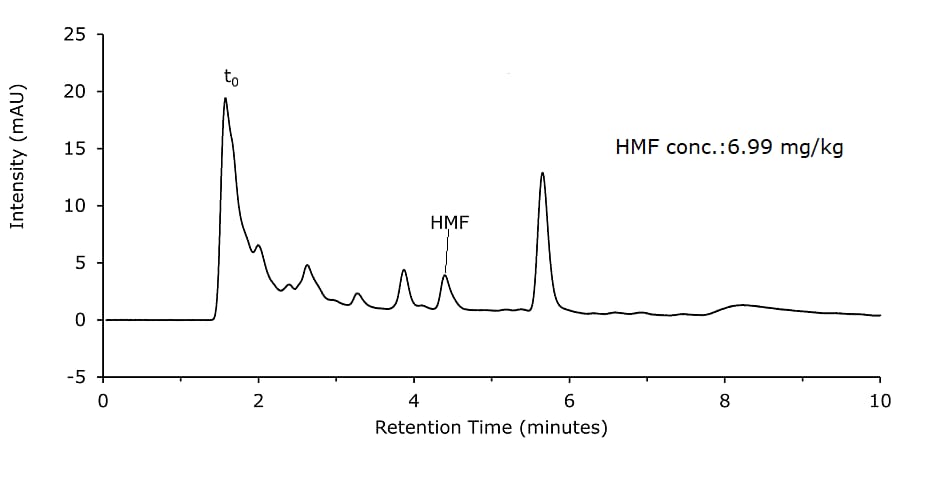
Honey samples were prepared with and without Carrez clarification and analyzed on a Chromolith monolithic silica column. Results are shown in Figures 1 & 2 and are comparable for both sample preparation approaches.
During this study, in which 33 honey samples were analyzed, the column backpressure did not increase noticeably and stayed constant in the range of 54 bar (783 psi), documenting the column's robustness against matrix.

Figure 1.Honey sample diluted, Carrez cleared, and filtered (Sample Solution 1)

Figure 2.Honey sample diluted and filtered (Sample Solution 2)
Calibration
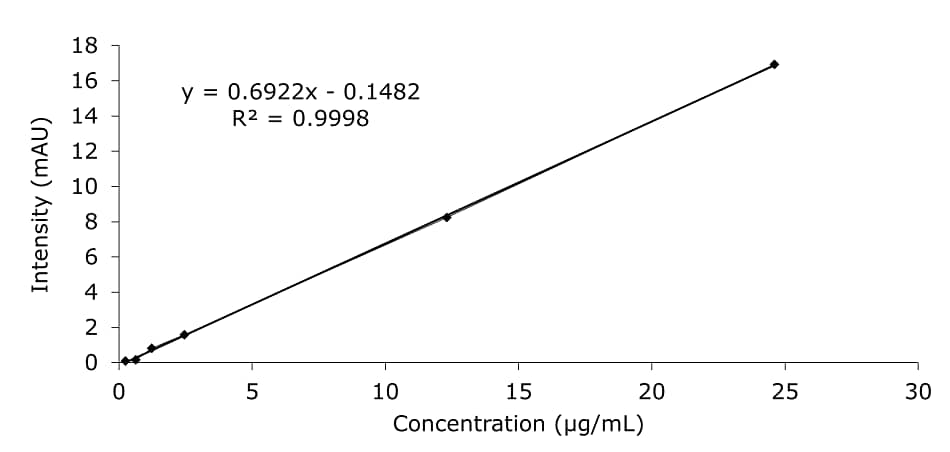
The HMF content of the honey samples was quantified using an external calibration approach in the range of 0.25–24.60 µg/mL dissolved in diluent (Figure 3). The LC method’s limit of detection (LOD) for calibration solution in diluent was at 0.5 µg/L, limit of quantification (LOQ) was at 1.6 µg/mL (Table 2).

Figure 3.Calibration data for HMF in diluent.
Recovery and Reproducibility
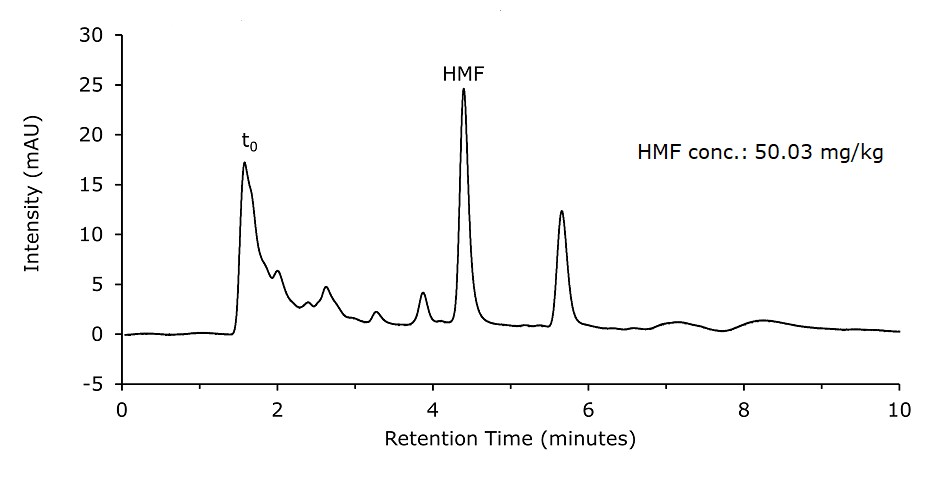
Using the dilution & filter method (Sample Solution 2), for 5 injections of the spiked honey sample (40 mg/kg spike, Figure 4), an RSD of 0.7% (Table 3) was determined and a spike recovery of 108% observed (50.03–6.99 mg/kg = 43.31 mg/kg).

Figure 4.Spiked Honey sample (40 mg/kg) diluted & filtered (Sample Solution 2)
For a second honey sample (data not shown), an HMF content of 18.47 mg/kg was determined for sample solution 2 approach of the pure honey. The spiked sample (40 mg/kg spike added) showed a 55.13 mg/kg content, representing a 91.7% recovery and an RSD of 0.3% (n=5).
Conclusion
The transfer of the DIN 10751-3 method for the quantification of HMF in honey to a Chromolith® HighResolution RP-18e 100 x 2 mm column was successfully demonstrated with low LOD and LOQ values as well as good reproducibility. The unique pore structure of the Chromolith® HighResolution (HR) column offers a high matrix tolerance and eliminates the need for the common Carrez clarification step during sample preparation and shortens the workflow, saving time and labor. The column backpressure did not increase during the study, underlining the matrix robustness of the Chromolith® columns in this respect.
More applications on Food & Beverage Testing.
REFERENCES
계속 읽으시려면 로그인하거나 계정을 생성하세요.
계정이 없으십니까?